Site Heatmap enables you to conduct a competitive qualitative content analysis, not just for the SERP, but for any website you choose. But when you have multiple heatmaps, how do you make sense of all that data?
Here’s one approach.
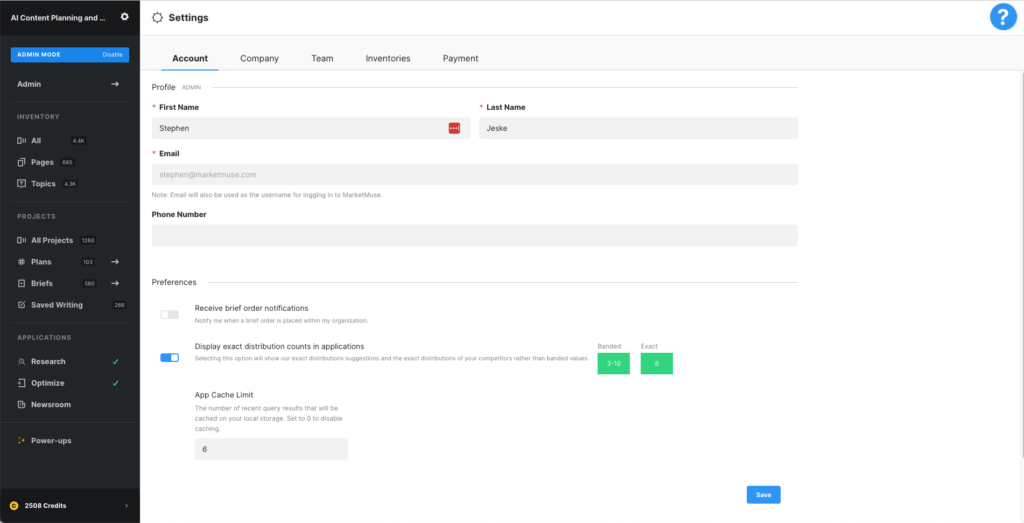
First, you need to go to Settings by clicking the gear icon next to the name of your domain in the upper left corner.
Toggle “Display exact distribution counts in applications” to the on position — it will change from gray to blue. We need this in order to get numerical data in our spreadsheets, as opposed to number ranges displayed as text.

Go to Heatmap and generate the heatmap for the sites your interested in, each time exporting the results to a CSV file.
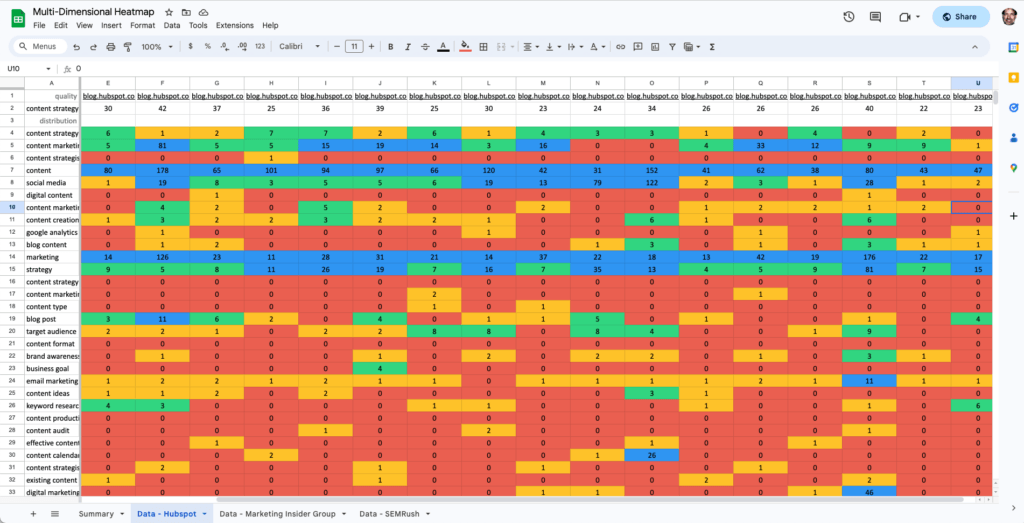
Create a spreadsheet like this example (this links to a Google Sheet).

You’ll have individual sheets for each site’s data and then a summary sheet. Having mentions in number format, instead of text, opens up a realm of possibilities.
By using COUNTIF and COUNTIFS, the summary sheet summarizes how frequently pages mention those terms, using the same grouping as you find in the heatmap.

Here’s how to read the spreadsheet. For the term “content strategy” in Hubspot:
- 3 of the pages have 0 mentions of that term.
- 6 pages have 1 to 2 mentions
- 9 pages have 3 to 10 mentions
- 5 pages have 10 or more mentions
Essentially what we’ve done is rolled up mentions to the site level, grouping them according to the same ranges used at the page level.
